Impact of Major Wars on India’s Nifty 50 (1996– Present)
Kargil War (May–July 1999)
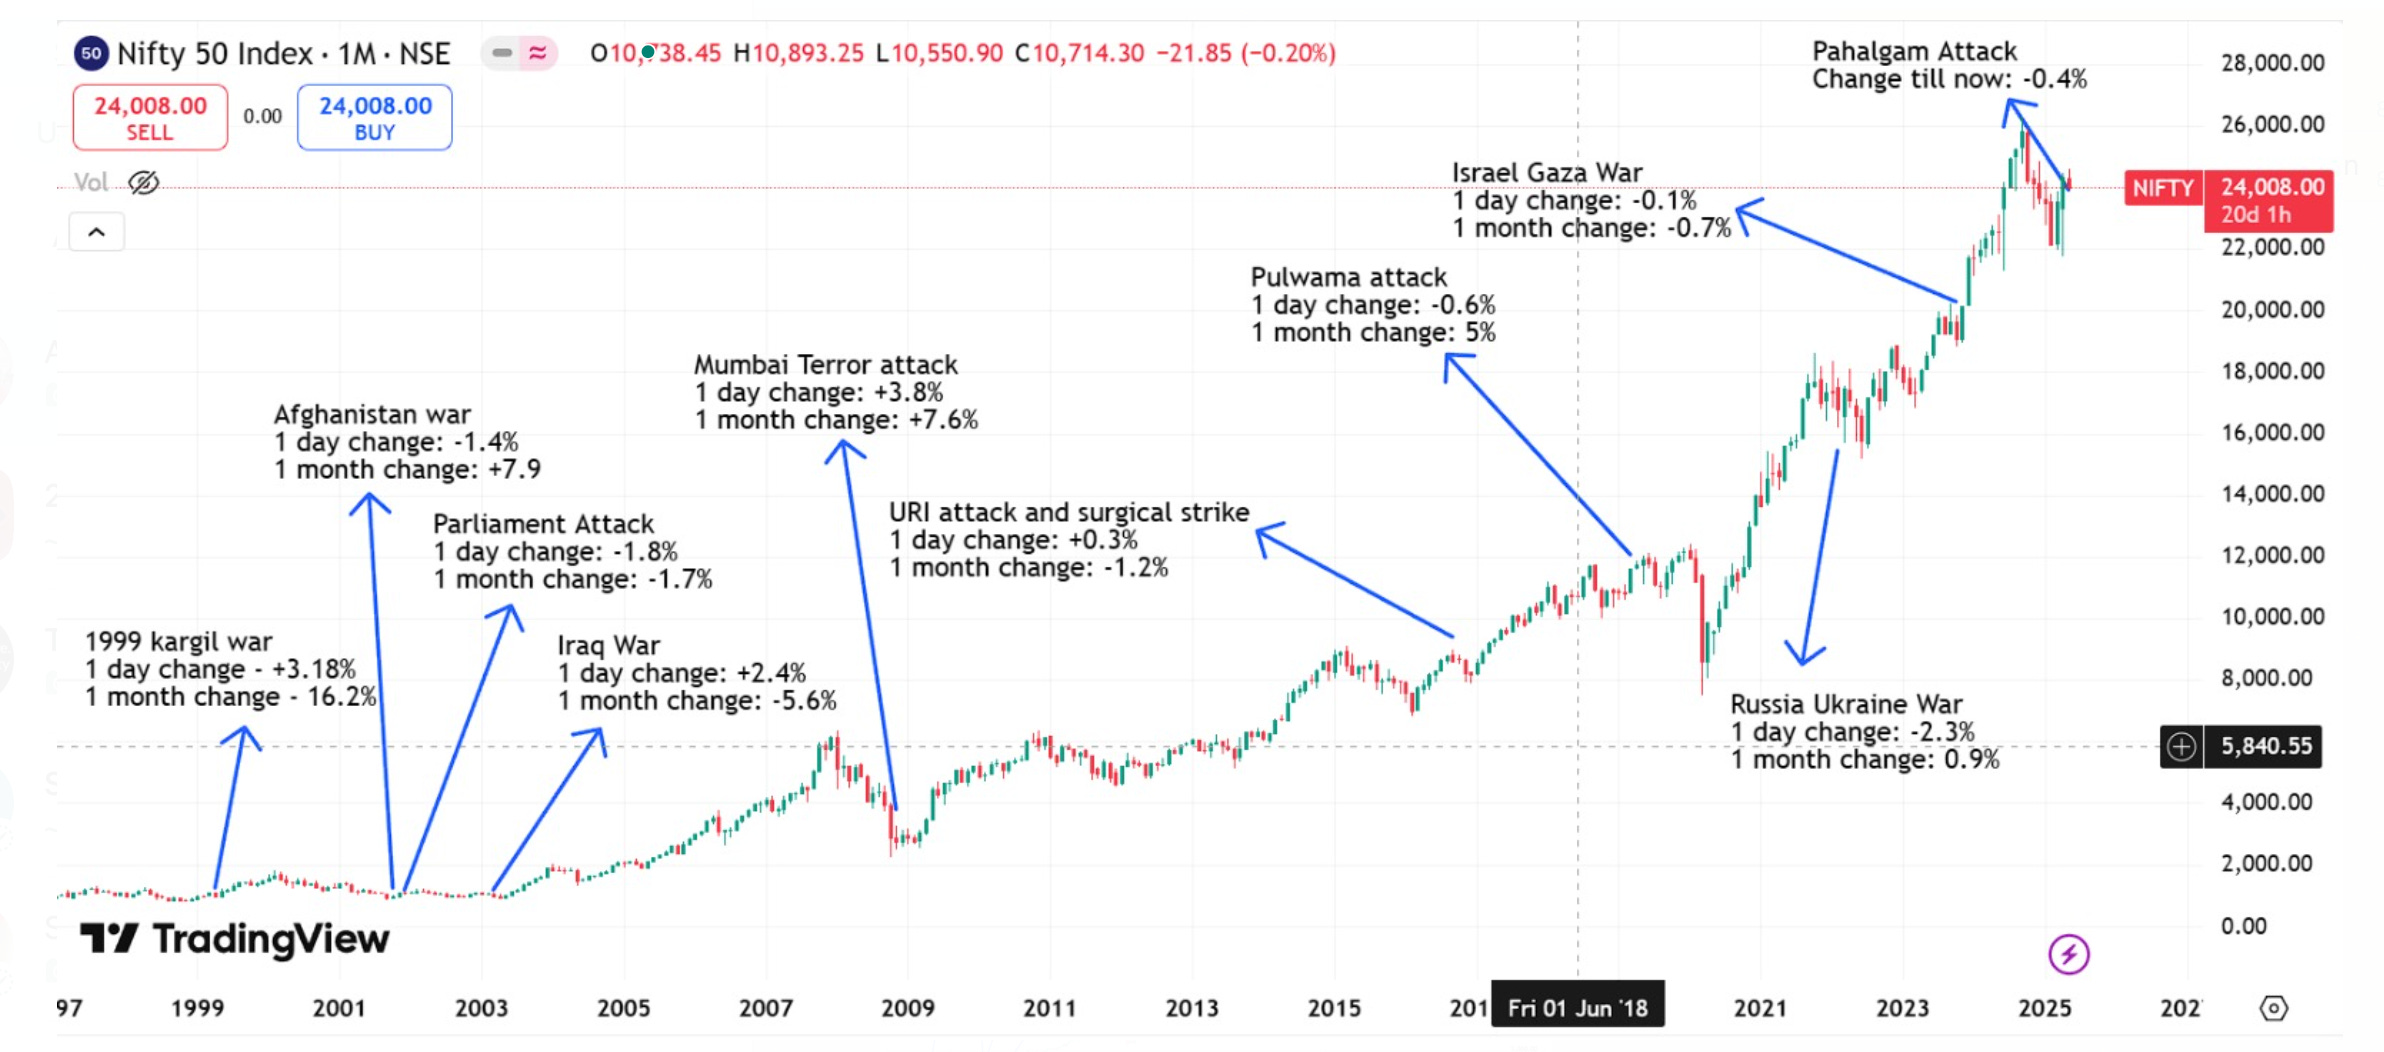
The Kargil War (3 May–26 July 1999) saw the Nifty 50 begin near 978 on 30 April 1999, just before the conflict escalated. Using historical NSE data, one trading day later (4 May), the index rose to approximately 1008 (+3.08%). It continued to rally over the following weeks. About one week later (10 May), Nifty was up around 10.6% (≈1094), and by one month later (3 June), it had increased roughly 16.2% to 1136. By three months after (3 August), it had surged 31.0% from the start, reaching approximately 1285. Overall, the markets dipped only briefly and then recovered strongly during this conflict.

War in Afghanistan (Oct 2001–Aug 2021)
The U.S.-led invasion of Afghanistan began on 7 October 2001. Just before the conflict (on 5 October), the Nifty 50 index was around 914. By the next trading day (8 October), the index declined slightly to approximately 901.95, a −1.4% drop. However, the market began recovering shortly thereafter—within a week (12 October), the index had climbed to about 960, a +5% gain from the pre-conflict level. By one month later (7 November), it stood at 987.5 (+7.9%), and by three months (7 January 2002), the index had rallied to roughly 1100, marking a solid +20.0% increase. Overall, despite an initial dip, the market recovered steadily during the prolonged conflict.

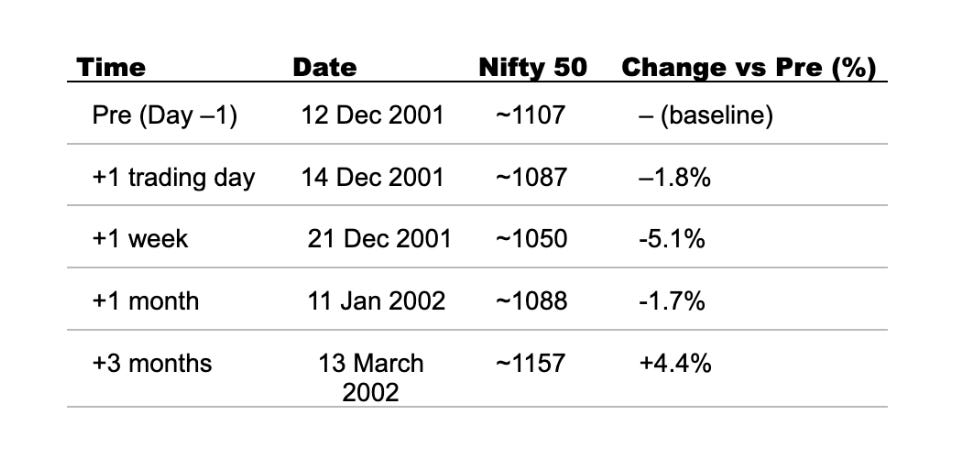
Parliament Attack (Dec 2001)
The attack on the Indian Parliament occurred on 13 December 2001, triggering geopolitical tension and uncertainty. Just before the incident (on 12 December), the Nifty 50 index was around 1107. By the next trading day (14 December), the index had dropped to approximately 1087, a −1.7% decline. A week later (21 December), it fell further to about 1050, down −5.1% from the pre-attack level. However, the market began stabilizing in the following weeks. By one month later (11 January 2002), the index returned to around 1088 (−1.7%), and by three months (13 March 2002), it had recovered to roughly 1157, a +4.4% gain over the pre-attack level. Despite initial volatility, the market showed resilience and gradual recovery after the event.
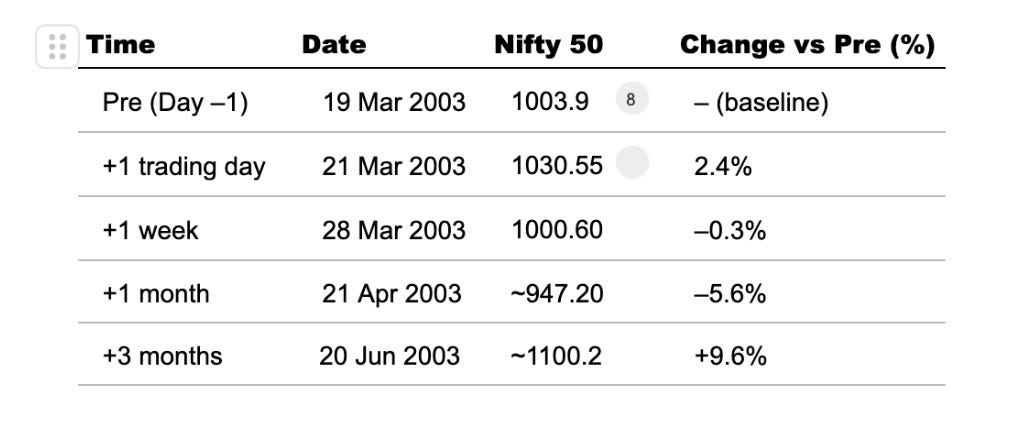
Iraq War (March 2003 Onwards)
The Iraq War began on 20 March 2003. On the day before the outbreak (19 March), the Nifty 50 index stood at 1003.9. On 21 March 2003 (the next trading day), the index rose to 1030.55, reflecting a +2.4% gain, possibly due to clarity around the onset of conflict. However, by 28 March (one week later), the index had slipped to 1000.60, a slight −0.3% decline from pre-war levels. Over the next month, the index declined further to around 947.20 by 21 April 2003, marking a −5.6% drop. Interestingly, by 20 June 2003 (three months after the conflict began), the Nifty rebounded to approximately 1100.2, representing a +8.7% rise from pre-conflict levels. This reflects early volatility, short-term pessimism, and then a significant recovery—likely driven by market reassessment of the conflict’s impact and improving investor sentiment.
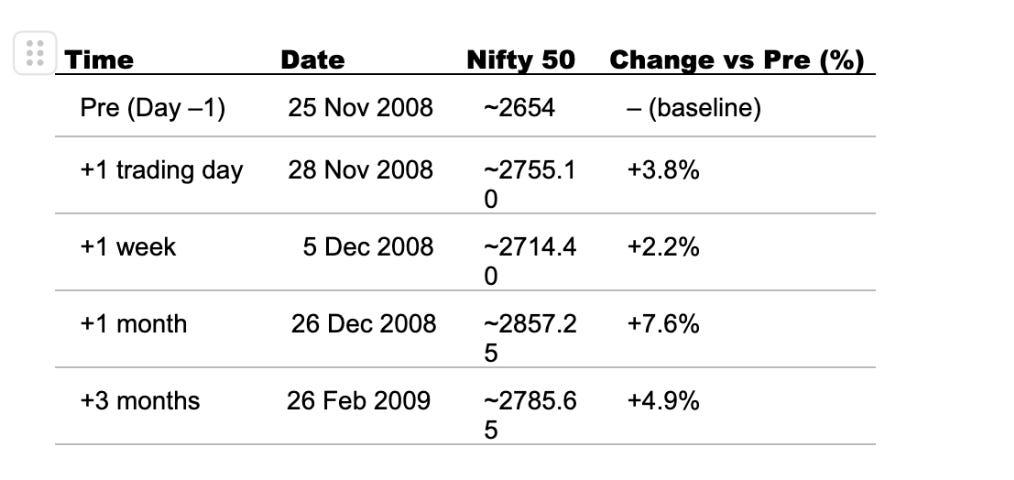
Mumbai Terror attack (Nov 2008)
The 26/11 Mumbai terror attacks began on 26 November 2008. Just before the incident (25 November), the Nifty 50 index stood at approximately 2654. Surprisingly, the market responded positively in the immediate aftermath—by the next trading day (28 November), it had risen to around 2755.10, marking a +3.8% gain. A week later (5 December), the index remained relatively higher at 2714.40 (+2.2% vs pre-attack). Momentum continued through the following month, with the Nifty reaching 2857.25 by 26 December (+7.1%). Although some gains cooled off, by three months (26 February 2009), it still held at 2785.65, up +4.9% from pre-attack levels. This recovery pattern underscores the market’s resilience, even amid severe domestic security shocks, as broader economic factors began to weigh more heavily than short-term geopolitical events.
Uri attack and Surgical Strike (Sep 2016)
The Uri terror attack occurred on 18 September 2016, with heightened geopolitical tensions emerging immediately afterward. On the last trading day before the attack (16 September), the Nifty 50 index stood at around 8,779. When the markets reopened on 19 September, the index edged slightly up to 8,808, reflecting a +0.3% gain, suggesting a muted immediate reaction. However, by 28 September (a week later), it had dipped slightly to 8,745.15, down −0.3% from pre-attack levels. The decline continued over the next month, with the index reaching around 8,677.90 by 18 October, marking a −1.5% drop. By the three-month mark (18 December), the index had declined further to about 8,139.45, showing a −7.2% decrease from the levels before the attack. This trajectory reflects a delayed but sustained negative market response, highlighting concerns about escalating cross-border tensions and their potential economic impact.

Pulwama Attack and Balakot Airstrike(Feb 2019)
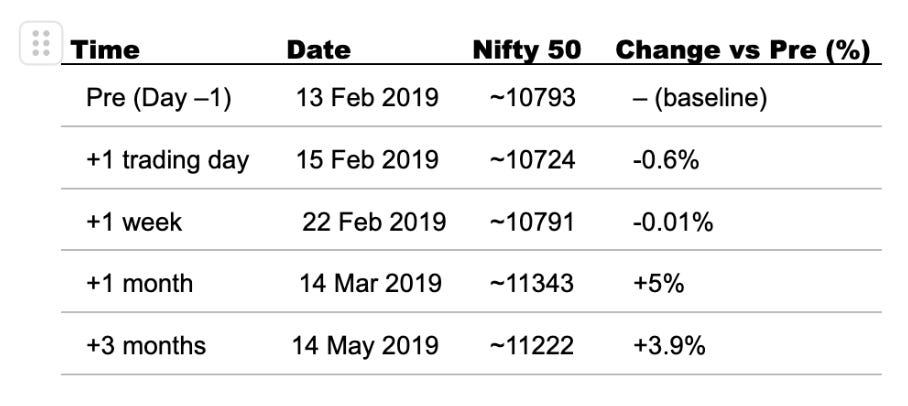
The Pulwama attack occurred on 14 February 2019, with the retaliatory Balakot airstrike taking place on 26 February 2019, both escalating geopolitical tensions. On the day before the Pulwama attack (13 February), the Nifty 50 index stood at around 10,793. When markets reopened on 15 February, the index slightly declined to 10,724, a −0.6% dip. One week later (22 February), the index was almost unchanged at 10,791 (−0.01% vs pre-attack levels), showing a neutral reaction overall. However, by one month (14 March), the index had surged to 11,343, a strong +5% recovery—possibly buoyed by investor confidence despite rising geopolitical risks. By three months (14 May), the index moderated slightly to 11,222, still maintaining a solid +3.9% gain over pre-attack levels. This market trajectory suggests investor resilience and confidence, likely underpinned by strong macroeconomic fundamentals and political stability during an election year.
Russia–Ukraine War (Feb 2022)
The full-scale Russia–Ukraine conflict began on 24 February 2022. On the day before the invasion (23 February), the Nifty 50 index was around 17,063. As the conflict broke out, markets reacted sharply, with the index plunging to 16,247 on 24 February, a decline of −4.8%. However, a swift rebound followed—by the next day (25 February), the Nifty had recovered to 16,658.4, showing a +2.5% rise from the previous close. Over the next month (by 24 March), the market had stabilized, with the index at ~17,200, a modest +0.7% gain from pre-conflict levels. This trajectory highlighted the market’s rapid adjustment to geopolitical shocks, underpinned by investor confidence in macroeconomic fundamentals and central bank responses.

Israel–Gaza Conflict (Oct 2023)
The Israel–Gaza conflict escalated in October 2023, impacting global markets with ripples felt in Indian equities. On 5 October 2023, the Nifty 50 index stood at approximately 19,545.7. A slight dip followed, with the index closing at ~19,512.5 on 9 October, marking a −0.1% change. However, by 16 October (a week later), the index had risen to around 19,731.8, showing a +0.9% gain from pre-event levels. This initial recovery was short-lived, as by 7 November 2023, the index declined to ~19,406, representing a −0.7% drop. Interestingly, over the next two months, markets rebounded significantly, and by 7 January 2024, the Nifty surged to approximately 21,710, reflecting a +11.07% rise compared to pre-conflict levels. This trajectory suggests early uncertainty, followed by robust investor confidence and market optimism despite geopolitical tensions.

Pahalgam Attack (April 2025)
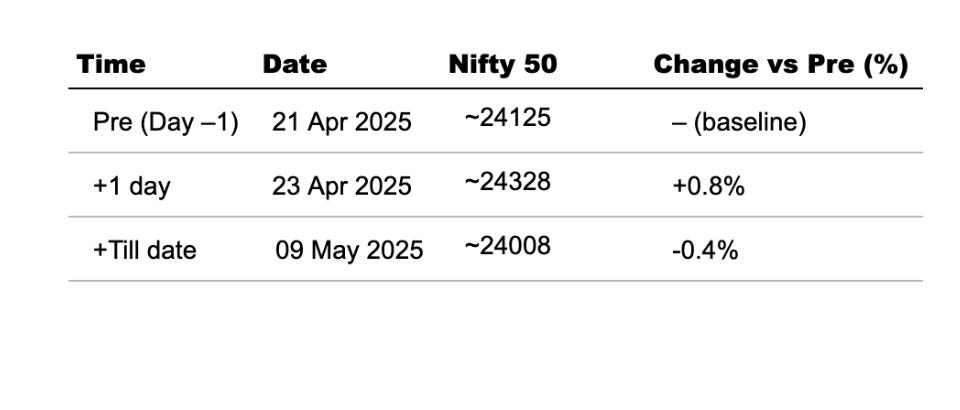
The Pahalgam Attack occurred in April 2025. While the direct market impact may have been delayed, we observe market movements around April 2025, suggesting a period of increased geopolitical tension. On 21 April 2025, the Nifty 50 index stood at approximately 24,125. The following day (23 April 2025), the index rose to about 24,328, marking a +0.8% gain, indicating a brief positive market sentiment. However, by 9 May 2025, the index had slightly declined to around 24,008, reflecting a −0.4% dip from the pre-event level. This trajectory suggests initial optimism or resilience, followed by slight erosion—possibly due to sustained geopolitical uncertainty or market reassessment.
Key Takeaways: Market Response to War & Conflict Events
1. Indian Stock Market is Highly Resilient to Geopolitical Events
– Initial dips are short-lived — in most cases, markets recover within 1 to 3 months.
– Even high-profile events like Kargil, Parliament Attack, Pulwama, and 26/11 saw Nifty rebound strongly, often exceeding pre-event levels.
2. Conflicts Often Trigger Buying Opportunities
– Kargil War → +31% gain in 3 months
– Afghanistan War → +20% gain in 3 months
– Israel–Gaza (2023) → +11% gain in 3 months
– These rallies suggest investor optimism returns fast, especially once immediate uncertainty fades.
3. Short-Term Volatility, Long-Term Calm
– Conflicts create 1–5% immediate declines (e.g., Russia-Ukraine 2022, Uri attack), but often recover in a matter of weeks.
– The market prices in risk quickly, and then reverts to tracking macroeconomic fundamentals.
“What lessons do you take from India’s market resilience through all these events?”
If you are worried about recent market fluctuations Talk to Us