The Reserve Bank of India (RBI) has published the most recent figures for the Index of Industrial Production (IIP). In this article, we will break down what these numbers actually mean in simple terms. Is the economy growing steadily, or is it slowing down? Now, let’s understand the story behind these figures.
Before we look at the actual numbers or results, it’s important to first understand what the IIP is and what it signifies for the economy.
What is Index of Industrial Production (IIP)?
The Index of Industrial Production (IIP) measures the performance of various industries in India over a period of time. Simply, it shows how much industries are producing compared to the previous period. RBI Release this Data on 28th of Every Month or next working day if 28th is a holiday.
The IIP is calculated using data collected from various source agencies, which in turn gather information from the factories and establishments that actually produce the goods.
– If the IIP increases, it means industries are producing more, indicating that the economy is active and growing.
– If the IIP decreases, it means industrial production is slowing down, which could be a sign that the economy is facing challenges.
What industries does IIP cover?
The IIP measures growth across different industry groups of the economy. These are classified as:
Broad Sectors
1) Manufacturing Sector Which includes 809 items
2) Mining Sector Which includes 29 items
3) Electricity Sector Which includes 1 item
Use-based Sectors
1) Capital Goods (machines, tools, equipment)
2) Basic Goods (essential raw materials)
3) Intermediate Goods (semi-finished products used in further production)
4) Infrastructure/Construction Goods (cement, steel, etc.)
5) Consumer Durables (cars, appliances, electronics)
6) Consumer Non-Durables (FMCG items like food, soap, medicines)
Eight Core Industries
The eight core industries account for about 40% of the total weight of IIP. These are:
– Electricity
– Steel
– Refinery Products
– Crude Oil
– Coal
– Cement
– Natural Gas
– Fertilizers
Refinery products hold the highest weight in the IIP’s core industries, accounting for about 28.04% of the total 40% share, followed by electricity at 19.85% and steel at 17.92%.
Recent Data Release by the RBI
The National Statistics Office (NSO) under MoSPI has recently released the IIP data for July 2025
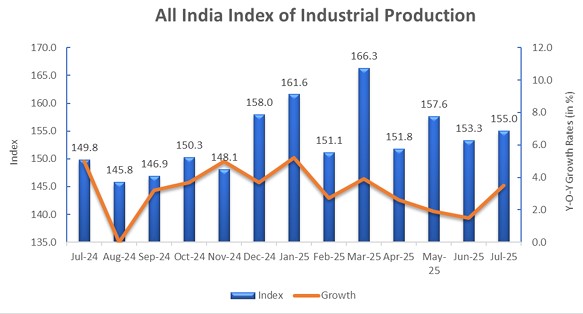
.The IIP growth rate for July 2025 is 3.5%, up from 1.5% in June 2025, showing an improvement in industrial activity.
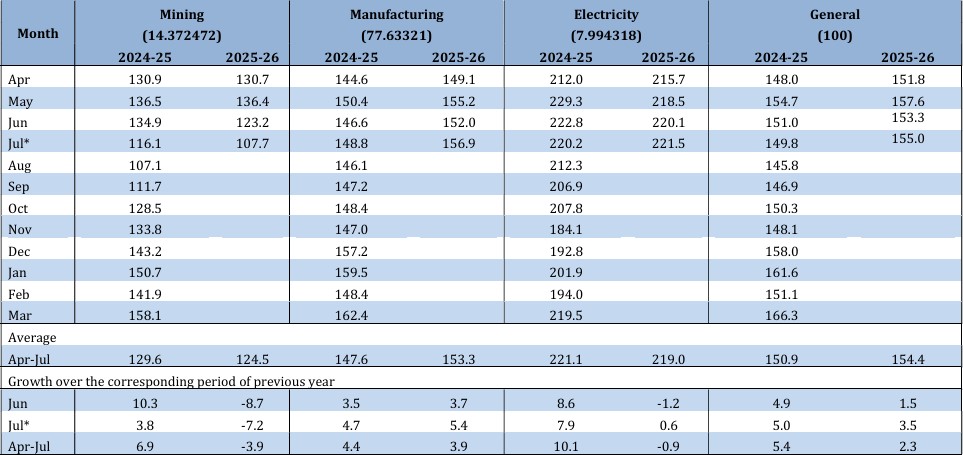
– Sector-wise growth for July 2025:
1) Mining: -7.2%
2) Manufacturing: 5.4%
3) Electricity: 0.6%
– In July 2025, the Quick Estimate of IIP reached 155.0, compared to 149.8 a year earlier.
– The IIP numbers for different sectors in July 2025 are as follows:
1) Mining: 107.7
2) Manufacturing: 156.9
3) Electricity: 221.5
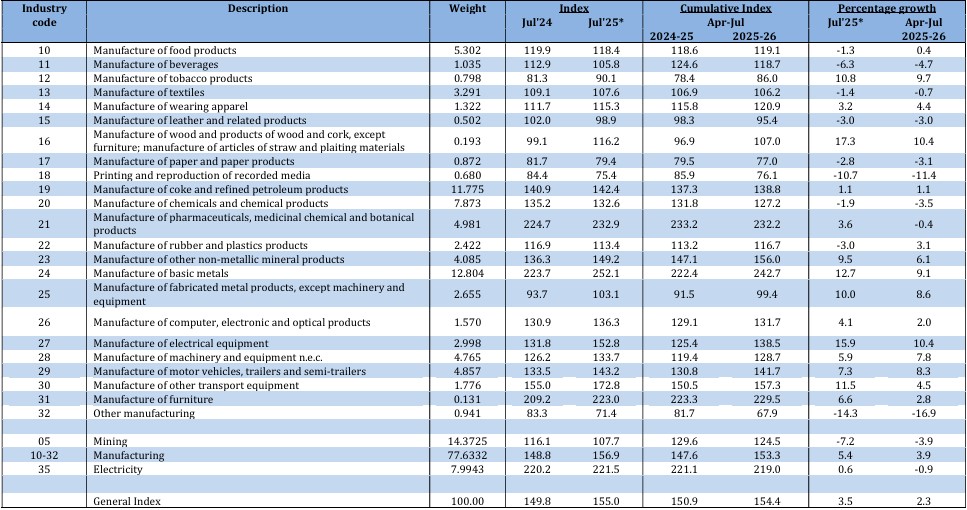
In July 2025, 14 of the 23 industries in the manufacturing sector showed positive growth over last year.
– Manufacture of basic metals – 12.7% growth
Products like MS slabs, HR coils and sheets of mild steel, and flat alloy steel products played the biggest role here.
– Manufacture of electrical equipment – 15.9% growth
Items such as electric heaters, switchgear and circuit breakers, control panels, and small transformers helped boost this sector.
– The manufacture of other non-metallic mineral products grew by 9.5%
Growth here mainly came from cement (all types), cement clinkers, and marble slabs (polished or unpolished).
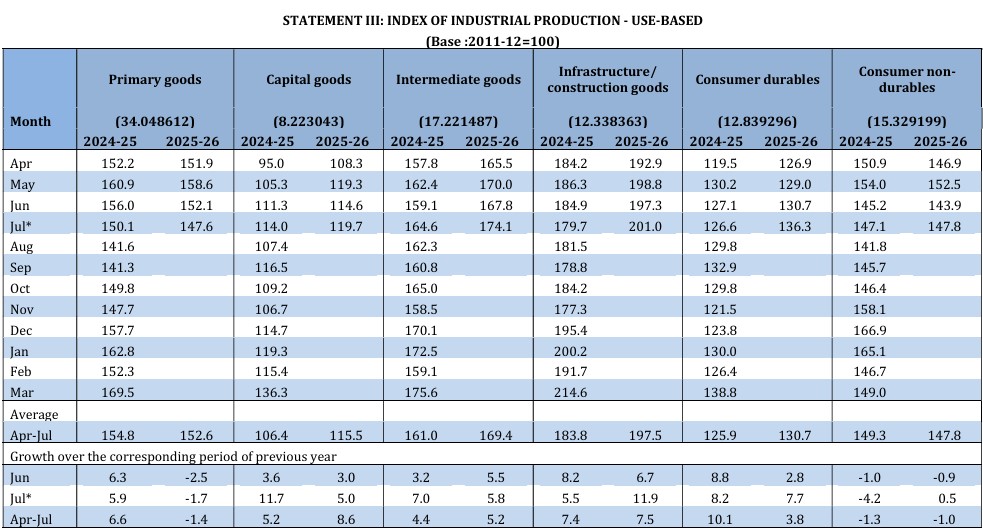
Looking at the IIP from the use-based classification (which shows what the goods are mainly used for), here are the results for July 2025:
1) Primary Goods: The index stood at 147.6, showing a decline of 1.7%
2) Capital Goods: Index at 119.7, growth +5.0%
3) Intermediate Goods: Index at 174.1, growth +5.8%
4) Infrastructure/Construction Goods: Index at 201.0, growth +11.9%
5) Consumer Durables: Index at 136.3, growth +7.7%
6) Consumer Non-Durables: Index at 147.8, growth +0.5%
Key Takeaway
The top three industries that pushed IIP growth in July 2025 were:
1) Infrastructure/Construction Goods
2) Intermediate Goods
3) Consumer Durables
This shows that construction activity, production of semi-finished goods, and demand for durable items (like appliances, vehicles, electronics) were the main drivers of industrial growth during this period.
Conclusion
Overall, the Production Industries grew 3.5% in July 2025 as compared to 1.5% in June. This growth was mainly supported by the Manufacturing Sector and Infrastructure/Construction Goods. Experts believe that factors like a good monsoon, lower inflation, interest rate cuts, and tax benefits will support growth in the coming months. At the same time, global challenges such as trade tariffs and weak global demand remain a risk.
Source by: RBI