India raised its defence equipment budget 24%. Defence stocks fall 9% in the same session. Four gates explain the gap.
The day the numbers went up and the stocks went down
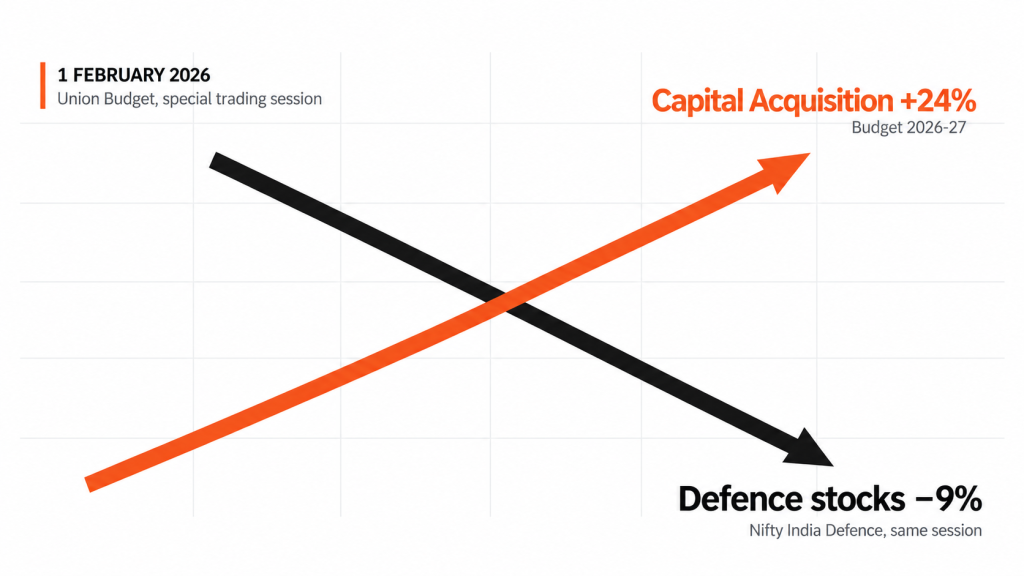
On Sunday, 1 February 2026, in a special Budget trading session, the defence services received a record allocation under the capital head. Capital expenditure rose to ₹2.19 lakh crore from ₹1.80 lakh crore in the previous Budget Estimate, up 21.8%. Within that, ₹1.85 lakh crore was earmarked for capital acquisition, which covers major equipment and platform procurement, up about 24% — and roughly ₹1.39 lakh crore of it was reserved for domestic industry.
The Nifty India Defence index fell about 9%.
Some of that was not about defence. The Nifty 50 also settled around 2% lower, with the Budget’s increase in securities transaction tax on derivatives among the factors weighing on sentiment, and a Sunday special session carries thin liquidity that amplifies moves. Even against that broader decline, defence underperformed by around seven percentage points — on the day the government announced a 24% rise in the equipment procurement budget.
The individual moves were severe. Bharat Electronics, an index heavyweight, closed 6.02% lower. Intraday, Bharat Dynamics fell about 10%, and reports placed Garden Reach Shipbuilders, Data Patterns, Paras Defence, Mazagon Dock, Cochin Shipyard, HAL and BEML somewhere between 7% and 14% at their weakest, depending on the moment sampled.
This was not one company disappointing. The sector repriced together.
If you held a defence stock that day, you experienced something that felt irrational. It was not. It was a lesson in how budgets actually connect to share prices, and the connection is longer and looser than most investors assume.
The short answer: the increase was already expected
Start with the simplest explanation.
Brokerages had been forecasting the defence budget for weeks. Kotak Institutional Equities had projected roughly a 20% increase in defence spending. When the numbers landed, commentary split: some analysts read the rise as broadly meeting expectations, while others reported it as a miss on capital outlay. That disagreement is itself instructive. The same figure produced opposite verdicts depending on what each reader had assumed beforehand.
What the commentary did share was the absence of an event. There was no clearly announced one-off procurement decision, policy overhaul or front-loaded spending push that on its own would have forced anyone to raise sector earnings estimates.
The base was also high. By November 2025, close to 62% of the FY26 defence capital budget had reportedly already been spent. A government already spending its existing allocation quickly makes the following year’s increase look less like acceleration.
That explains the day. It does not explain the deeper question: why is a 24% rise in the equipment budget such a weak signal about company earnings in the first place?
For that, follow the money.
The Four Gates: from Budget speech to balance sheet
A budget allocation is permission to spend. It sets the size of the pool and little else. Four gates sit between that permission and a rupee of profit in a company’s accounts, and each one is capable of narrowing the flow.
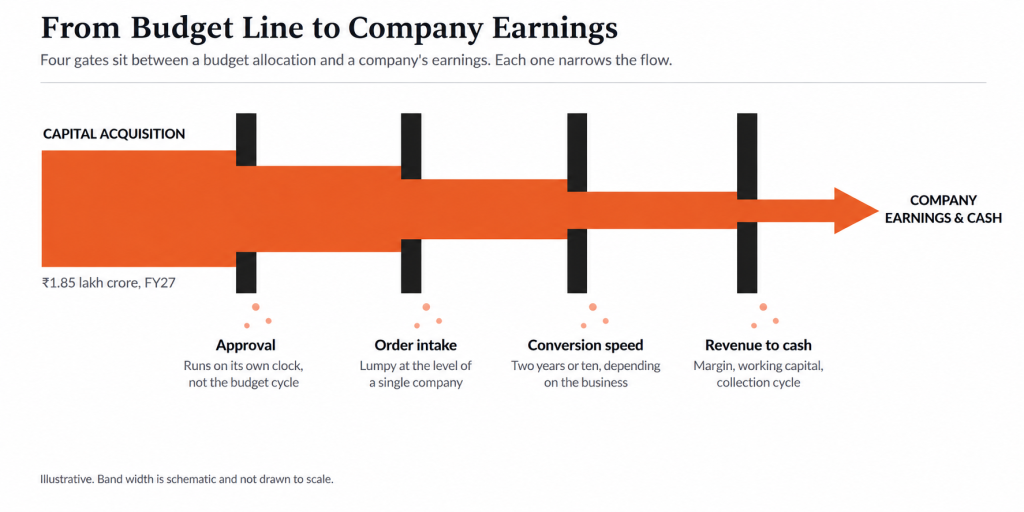
Gate one: approval runs on its own clock
Before anything is bought, the Defence Acquisition Council must grant Acceptance of Necessity — in-principle clearance that a capability is required. This runs on capability logic under the Defence Acquisition Procedure, not on the annual budget cycle. The two are parallel tracks, and both must clear.
In FY26, the DAC granted AoNs worth ₹6.73 lakh crore. In the same year, capital procurement contracts signed totalled roughly ₹2.28 lakh crore.
It is tempting to divide one by the other and call the gap leakage. That would be wrong, and it is worth understanding why. The contracts signed in FY26 mostly came from approvals granted years earlier. The approvals granted in FY26 will become contracts, if they do, across FY28 to FY31. An AoN is not a claim on this year’s budget. It is a claim on several future ones.
What the numbers actually demonstrate is lag, and lag is easier to see in a single programme than in an aggregate.
A quick-reaction surface-to-air missile system worth approximately ₹30,000 crore received AoN in July 2025. As of early September 2026, the contract remains unsigned, awaiting Cabinet Committee on Security clearance. The manufacturer has said its own work is complete.
Fourteen months from approval. Still no order.
Major DAC announcements can move defence stocks sharply on the day they are reported, though the magnitude varies by announcement and by company. The approved value, meanwhile, may take years to work through contracting, execution and revenue recognition.
Gate two: company order intake is lumpy in a way budgets are not
Here is the annual order intake of Bharat Electronics, the largest listed Indian defence electronics company:
| Year | Order intake |
| FY24 | ₹35,060 crore |
| FY25 | ₹18,715 crore |
| FY26 | ₹29,170 crore |
Intake nearly halved, then recovered by more than half, and still finished below where it stood two years earlier.
The defence budget did not halve and recover over those three years. BEL’s order intake did.
That is the heart of the argument. At the level an investor actually experiences — one company, one financial year — the relationship between budget growth and order growth is weak. A single programme signing or slipping moves the annual figure by 30% or more. Anyone who drew a trend line through FY24 and FY25 reached a conclusion that FY26 immediately contradicted.
Gate three: conversion speed varies enormously by business
This is where the “not every stock” part of the question gets answered.
“Defence stock” is not one category. It is several businesses with different conversion speeds.
Shipbuilding
Runs on decade-scale programmes. Garden Reach ended FY26 with an order book of about ₹15,300 crore, roughly 2.2 times revenue and around two years of execution visibility, according to brokerage estimates from Choice and SMIFS. Both houses project that a Next-Generation Corvette contract, variously reported at ₹25,000 to ₹33,000 crore, could push the order book past ₹50,000 crore and extend visibility to eight to ten years. That is a projection, not a fact — but it shows how a single contract can transform a shipyard’s outlook overnight.
The longer pattern is instructive too. The combined order books of the three listed defence shipyards were broadly flat from FY19 onward, while combined revenue rose from about ₹8,900 crore in FY19 to ₹12,400 crore in the first nine months of FY25 alone — a figure that is not annualised, and therefore understates the full-year gap. They spent years converting backlog faster than they replaced it.
Defence electronics
Generally turns faster than large shipbuilding programmes, across many smaller contracts, though timelines vary by product and programme.
Simulators and services
Carry an annuity element. Zen Technologies’ order book of ₹1,239 crore as of June 2026 included ₹318 crore of annual maintenance contracts, recurring by design.
Explosives and consumables
Are re-ordered rather than delivered once.
A budget line for missiles does nothing for a shipyard. This is why some defence stocks move on a given announcement and others do not.
Gate four: revenue is not profit, and profit is not cash
Faster execution is not the same as more profitable execution.
In Q1 FY27, BEL grew revenue 25% year-on-year and its EBITDA margin still contracted about 300 basis points, to roughly 25% from 28%. Gross margin fell to 45.5% from 53.2%.
The reason is the part worth understanding. Management attributed the contraction largely to product mix, and said explicitly that commodity price inflation had not materially affected profitability. Material costs did rise 55.7%, but as a consequence of which contracts were executed, not because inputs became more expensive.
That is a more useful lesson than a cost-inflation story would have been. An order book is not one homogeneous pool of work. It contains high-margin and low-margin contracts, and the ones a company executes in any given quarter determine the margin it reports. Converting the backlog faster tells you how much revenue is coming. It tells you very little about what margin arrives with it.
Management retained its full-year guidance of an EBITDA margin above 28%, which is a reasonable reminder that a single quarter’s mix is not a trend.
Cash tells a two-sided story. Two measures from the same year make the point, and they look contradictory only until you see what sits between them.
Before working capital and tax, cash generation clearly improved: pre-tax cash generation rose to 44% of EBITDA in FY26, from 33% a year earlier.
After working capital and tax, operating cash flow was ₹1,540 crore, well up from ₹590 crore in FY25 but still only about 19% of EBITDA. Free cash flow, which also absorbs capital spending, converted at closer to 9%.
The step down from 44% to 19% is where working capital sits, alongside tax. And working capital is exactly where the pressure showed: trade receivables rose 41.2%, from ₹9,116 crore to ₹12,876 crore, against revenue growth of about 16%.
Payment timing on defence contracts follows contract-specific milestones and acceptance terms rather than work completed. Faster growth can therefore consume more working capital when receivables and inventory build ahead of collections.
The full answer: the price already contained the expectation
Now return to the opening idea, because it deserves proper weight.
A share price does not measure how good a business is. It measures how good a business is relative to what was already assumed.
Consider what preceded Budget day. Over the twelve months from 22 April 2025, the Nifty India Defence index returned 30.6% against 10.8% for the Nifty 50. That window is worth naming honestly: it starts from the Pahalgam attack, the event that triggered the rally, so it flatters the defence number by construction. The direction is still clear — by late August 2026 the index was trading within about 2.3% of its recent peak.
Now set that against delivery. Across brokerage coverage of the sector, FY26 revenue grew about 12% and profit after tax about 11%. That coverage universe is not identical to the index constituents, so this is a directional comparison rather than a precise one. The available data still points one way: share prices rose considerably faster than reported profits.
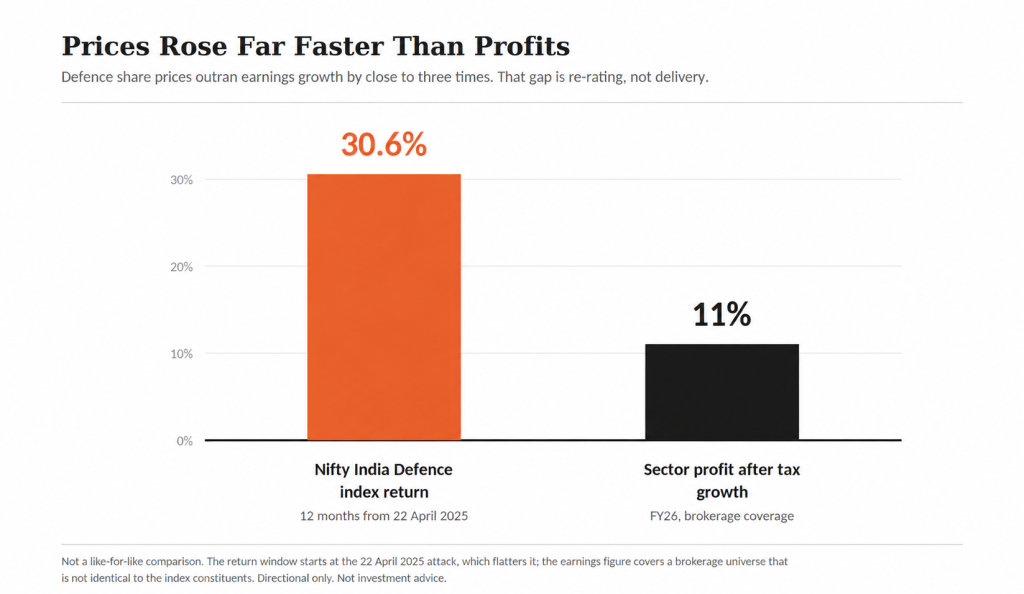
That gap is not earnings. It is re-rating — investors agreeing to pay more for each rupee of profit, in anticipation of profits to come.
Valuation shows where that left things. In late August 2026 the Nifty India Defence index traded at a P/E near 58.8 and a P/B near 11.6. In early September, the Nifty 50 sat at a P/E of about 20.2, roughly 8% below its own five-year median of 22.0. (The two readings are days apart and drawn from different providers, so treat the ratio as approximate.)
The defence index was trading at close to three times the broad market’s earnings multiple. And while the market sat slightly below its own historical average, defence sat well above any comparable measure of its own — a point worth holding loosely, since the index itself is recent and long-run valuation history for it is reconstructed rather than observed.
A multiple like that embeds expectations of future growth in the current price. Delivering in line with those expectations stops helping the share price, because in line was the assumption already priced. Only a surprise moves it up, and the absence of one moves it down.
That is what 1 February 2026 was. Not a bad budget. A budget that met expectations, arriving at a price that required beating them.
What to watch instead
If the budget is a poor predictor of your stock, what is a better one? Five numbers, all in published filings.
1. Quarterly order inflow against quarterly revenue. If a company books more than it delivers, the backlog is lengthening. If it delivers more than it books for several quarters, intake is slowing regardless of how large the order book looks. Both are commonly disclosed in quarterly investor presentations or exchange filings, though the format varies by company.
2. Order book divided by trailing twelve-month revenue, tracked across quarters. The level means little on its own. A 2.2x ratio can be healthy for a shipyard with multi-year execution visibility and mean something quite different for a services business. The direction carries the information.
3. Operating cash flow as a percentage of EBITDA, over five years. The fastest test of whether reported profit is turning into money in a government-contract business. Read the trend, not one year.
4. Receivable days, over five years. If the collection cycle stretches every year, the working capital needed to fund growth rises faster than the growth itself.
5. Build your own lag estimate. When a company announces a large order, note the date. Then watch for when revenue from that order first appears in its financials. Do this three or four times for the companies you follow and you will have your own estimate of the gap between announcement and earnings for that specific business. Of the five, this is the one that will change how you read the next headline.
The takeaway
India’s defence budget is real, rising and structurally supported. Nothing here disputes that.
But the budget is an upstream variable. It sets the size of the pool. It does not decide which company wins the contract, when that contract is signed, how fast it converts to revenue, what margin comes with the contracts that actually get executed, how long the cash takes to arrive, or what the market had already assumed before the announcement was made.
Four gates sit between a Budget speech and your portfolio, and the Budget itself clears none of them. It fills the pool. Everything after that is a separate question. Run any defence stock through the Four Gates before you buy the headline.
Which is why a 24% increase in the equipment budget and a 9% fall in defence stocks on the same day are not a contradiction. They are answers to two different questions: how much India intends to spend, and how much of that intention was already in the price.
The next time a Budget headline moves your defence stock, ask which gate the money is actually at.
This is the kind of analysis InvestVidhi applies before adding a defence name to a portfolio. If you’d like to see how,
Sources
- Ministry of Defence, Defence in Union Budget 2026-27, Press Information Bureau, 3 February 2026 — total allocation ₹7.85 lakh crore (+15.19%), capital expenditure 27.95% of the defence budget, ₹1.39 lakh crore earmarked for domestic industry.
- Budget 2026: Defence gets all-time high of ₹7.85 lakh crore after 15% jump, Business Today, 1 February 2026 — capital head ₹2,19,306.47 crore (+21.84%), capital acquisition ₹1.85 lakh crore (+24%), and defence stock moves on the day.
- BEL dips 4% on Q1 margin miss, Business Standard, 28 July 2026, citing Motilal Oswal Financial Services — Q1 FY27 EBITDA margin 25.1% against 28.1%, gross margin 45.5% against 53.2%, and management attributing the contraction to product mix rather than commodity price inflation.
- Bharat Electronics Ltd — Investor Relations — Annual Report FY2025-26, Q4 FY26 and Q1 FY27 results filings, order book and cash flow data.
- Ministry of Defence / PIB — FY26 Acceptance of Necessity approvals (₹6.73 lakh crore) and capital procurement contracts signed (₹2.28 lakh crore, 503 contracts).
- Choice Institutional Equities and SMIFS, defence shipbuilding initiation notes, June 2026 — shipyard order books and execution visibility.
- ICICI Securities, Aerospace & Defence sector review FY26 — sector revenue and profit growth.
- NSE Indices — Nifty India Defence and Nifty 50 index levels, returns and valuation ratios.
Index levels and valuation ratios as of the dates stated in the text. All company financial data as reported. Verified as of 10 September 2026.
Disclaimer: This article is for educational purposes only and does not constitute investment advice or a recommendation to buy or sell any security. The example, figures and assumptions used are illustrative. Investments in securities market are subject to market risks; read all the related documents carefully before investing. Past performance is not indicative of future returns.
SIHO Research Pvt. Ltd. — SEBI Registered Research Analyst | Reg. No. INH000019813